Some of the cabins at Kalaloch are (or were) quite close to the edge of the coastal bluff. Photo from 6 July 2023
Eroding coastal bluffs are hard to manage, especially when valuable assets are perched on their edges. Coastal bluffs are by definition tall, and their erosion can be rapid and forced by a variety of processes, so engineering solutions aren't always easy to devise, and are invariably expensive and difficult to maintain. At Kalaloch in Olympic National Park, two factors recently converged to create particularly dangerous problems. First, rates of erosion of coastal bluffs in a small area just south of Kalaloch Creek accelerated, and second, the locations where those erosion rates accelerated also happened to be developed. Buildings, in this case valuable rentable cabins at Kalaloch Lodge, were put at increased risk and, as a consequence, in March 2024, five cabins were deemed unsafe and removed.
A similar perspective as in the photo above, with cabins removed. The former cabin sites are marked with the brown burlap. Photo from 10 April 2024
I was part of efforts that looked for every opportunity to try to understand that erosion, in the hopes that some cause of erosion might be identified that could illuminate a potential solution. As is often the case, though, the best we can do is use our monitoring data to characterize rates of erosion, and how those rates vary along the shoreline, as I did in this recent recorded talk.
Camano Island on December 27th, 2022. Photo courtesy of Joan Schrammeck
The coastal flooding event in Puget Sound on December 27th, 2022 was extreme, and notable for a whole variety of reasons that I explored in this post shortly after the event. I've also finally, after playing with the data for almost a year, convinced myself that this event had a near zero chance of occurring without the sea level rise observed in Puget Sound over the past 100 years or so. This conclusion, if it holds up to scrutiny, is also a big deal, as it could be the first documented evidence of an actual impact of observed sea level rise in Washington.
The way that I went about thinking about this was to first generate what is called a return frequency curve, using annual maximum water level observed in Seattle and recorded by the tide gauge in Seattle since its inception in 1898. I focused on Seattle first because it was impacted by flooding on 27 December 2022, and it has a nice long tide gauge record to support an analysis like this. It is worth noting that I haven't yet repeated this analysis for any of our other tide gauges in Washington, and suspect that the results wouldn't be as clear because of their shorter records. NOAA generates return frequencies too, but here is what mine looks like:
These curves are useful, as they allow us to use the history of extreme events recorded at tide gauges to analyze the expected frequency and magnitude of extreme events . On the y-axis is the maximum water level elevation, in feet relative to Seattle's Mean Higher High Water, and on the x-axis is years, from 1 to 10,000 years (the scale is logarithmic). We can use statistical models to fit a curve to these data, in this case I used a Generalized Extreme Value (GEV) model:
The GEV model fit to the observed annual extreme water levels from Seattle suggests that that the event on December 27th, 2022, during which coastal water level in Seattle reached an elevation of almost 4 feet above Mean Higher High Water, has an annual chance of occurrence of about 0.2%, or in other words should be expected to occur about once every 500 years on average. It was an extreme event.
But sea level is also rising in Seattle, and we know that even small amounts of sea level rise can significantly change the likelihood of these types of extreme events. How did Seattle's history of sea level rise influence the likelihood of the extreme flooding observed on December 27, 2022? another way of putting this is, what would the likelihood of the peak water level from 27 December 2022 have been if there was no sea level rise occurring in Seattle? To try to answer this question I simply removed sea level rise from the record in Seattle (assuming it is a linear rate, which is what NOAA calculates, but may not be the case), and then re-calculated a return frequency curve (shown below in red):
and then repeated the process of fitting this set of hypothetical extreme events from Seattle with a new GEV model:
So here the impact of sea level rise on the return frequency curves is readily visible. But if we follow the water level of the December 27, 2022 event (the highest black dot in the plot) over to the left to find where it intersects the red curve...we see that it never intersects the red curve. This suggests that, based on the best fit to the data, the extreme water level reached during the December 27th event, at least as recorded in Seattle, would have been improbable in the absence of sea level rise.
Now these statistical models are uncertain, because they are built around a very small number of events (they are, after all, extreme), and above I show the 95% confidence intervals (the red dashed lines) around the best fit to the observations (the solid red line). Here the upper confidence bound DOES intersect with the water level elevation reached on December 27, 2022. But even if we assume that the "real" return frequency curve follows that upper confidence limit we find that the event observed on December 27th 2022, with sea level rise removed, has a return frequency of, at best, once in 700 years on average. At the very least it seems safe to conclude that sea level rise that has already occurred in Seattle made the extreme water level reached on December 27th 2022 more likely (a 1-in-700 year event becomes a 1-in-500 year event) than it would have been.
**I'm not extraordinarily well-versed with extreme value analyses, so I reached out to a colleague for a review (which I don't typically do with these blogs) and wanted to thank that reviewer for their time and contributions. I'm going to keep that person anonymous only to emphasize that any errors of interpretation are mine alone. I also want to emphasize that here I've assumed two things: 1) that sea level rise is the ONLY component of coastal flooding that is changing, which I think is likely the case but I didn't test, and that 2) the rate of sea level rise in Seattle is linear, which I think is a good assumption but could be incorrect.**
Another large gap in my blog, but I've got an excuse this time - I've been doing a good bit of publishing, and that has taken up whatever bits of time I can find for writing. And I have to say that I'm pretty pleased with what I've been able to be a part of this year, both in terms of the number of manuscripts, but also because of the variety, and a because most are open access. So here is the list thus far:
1) The first paper of the year came out in March, after I wrapped up a >2-year long project coming up with ways to try to measure sea level rise vulnerability in Puget Sound along with colleagues from Coastal Geologic Services. Typically, these kinds of projects end with something like a technical report but I was so interested in the results that I really wanted to carry it forward to publication.
2) The second of the lot, and the only one that is not open access, is the conference paper above (for the Coastal Sediments conference), that I wrote along with George Kaminsky from the Washington Department of Ecology, and Adrianne Akmajian from the Makah Tribe. I was pretty excited to get this one out, just because it allowed me to get a bit back into the sort of shoreline dynamics world that I love. This one is NOT open access, but available if you send an email to immiller@uw.edu
3) The next three are part of a special issue of Frontiers in Ecology and Evolution focused on large dam removals, and span a range. The big one for me was the second paper I've written with my dive team collaborators about our long-term investigation of the marine ecosystem in the Strait of Juan de Fuca. This one was definitely my big push for the year, and I am absolutely thrilled that it is out. It is open access, so find it here.
My first paper that I consider "terrestrial" was super fun to be a part of, though my contributions were pretty minor, was about how the vegetation community near the Elwha River mouth changed through dam removal. This one is accepted but not published as of yet, but should be shortly.
And the final paper in the special issue was entirely different for me, and also one that I made pretty small contributions to, but I'm proud of none-the-less. It is focused on documenting how we, across the entire Elwha research community, partnered with the community in various investigations. Find it here.
4) Will there be one more? I am deep into drafting another paper for a special issue of Oceanography, that will likely come out in 2024...but who knows...maybe we will get it out sooner....
Photo by David Barker, submitted to the King Tides program via MyCoast, on the morning of December 27th. Gig Harbor area
Well somehow I went a whole year without a post...not exactly sure what happened to be honest, except that I was very focused this year on a few projects that are now wrapping up. But an event that hit the Washington shoreline in the last week of December was more than enough to snap me out of it. The long and the short of it is that this event broke high water records at all but one of the tide gauges in the Puget Sound basin, some of them set 40 years ago. It was a doozy.
Photo by Joan Schrammeck, submitted to the King Tides program via MyCoast, on the morning of December 27th. Camano Island.
Most of the record-breaking for this event happened in the Salish Sea, and really in the Puget Sound basin, even though it was no walk in the park for Pacific Coast shorelines either. The photo below, for example, was taken at the trailhead on Rialto Beach in Olympic National Park on December 26th. The crest of the berm here is at an elevation of roughly 18 feet above MLLW, and if the water pushes much higher under the influence of tides, surge or wave run-up it spills down into the parking lot just behind.
Photo by Kim Sager-Fradkin, posted here with permission. Rialto Beach, Olympic National Park, December 26th.
But back to the Puget Sound basin, and here are the breakdowns of coastal water level records for the five tide gauges within the Puget Sound basin that set records during the event, specifically on the morning of December 27th, from north to south:
A few things of note here. First, the max water levels recorded in the table above are unverified as of yet, so may change. The Bremerton tide gauge is new, so not a surprise that a record was set there, but records were absolutely shattered in both Friday Harbor and Seattle, where tide gauges have been recording water level for 89 and 125 years, respectively. If the water levels are verified as they are reported in the table above, then Seattle's water level during this event was a full 7 inches above the record set just last year. To try to put that into context, that record was set last year on January 7th, 2022, by just barely exceeding the previous record (that one set in 1977) by less than half an inch.
Another surprise for me is just how wide-ranging this event was spatially...to have records set at tide stations in north and south Puget Sound on the same tide is notable to me. The various photos, and the astonishing video posted above, from the Point No Point area on the northern Kitsap Peninsula also illustrate this - they are coming in from all over Puget Sound.
What made it happen? The most obvious answer is that we rolled snake eyes in the annual game of chance that we play along the shoreline. The plot above is of water level (top panel), pressure (middle panel) and the "non-tidal residual" (storm surge, or the difference between the predicted and measured water level) for both coastal (left column) and Puget Sound (right panel) tide gauges. Essentially a high astronomical tide coincided with the peak of the low pressure passing through the area on December 27th, and that low pressure drove a very large (for our area) non-tidal residual that peaked at exactly the same time as the high tide. That same "perfect storm" didn't happen on the coast. Instead, the peak of the low pressure and non-tidal residual coincided with a falling tide, so while water levels were very high, they didn't shatter records.
But there are at least two other likely contributors that I'm not prepared to really rigorously attribute, but almost certainly played some role in driving water to record heights on December 27th. The first is sea level rise. At most of the locations in the table above there is a documented relative sea level rise trend. While the rate associated with that trend vary across those locations, in general they equate to something along the lines of a few inches over the four decades that have passed since many of our previous coastal water level records were set during the 1982-1983 El Nino winter. These few inches didn't "cause" this event, but they did contribute, and this on-going sea level rise makes it very likely that the records set in this December 27 event will be broken again. The second is the lunar nodal cycle, which is illustrated in the plot above this paragraph and was the subject of some media reporting last year. This astronomical cycle operates over a ~19 year period, and influences the range of the tides, or the difference between the average high and low tides. In other words, at the peak of this cycle, on average, high tides are a bit higher, and low tides are a bit lower. The data I show above are from the Friday Harbor tide gauge, and what I've done here is to average all of the highest tides for each year going back to the 1960's (to capture a few of these cycles)...and during the peak of the cycle the high tide is, on average, about 6-7 inches higher than it is during the bottom of the cycle. And we are, as you can see, heading towards a peak in this cycle. Again, this didn't cause this event, but may have contributed a bit to it.
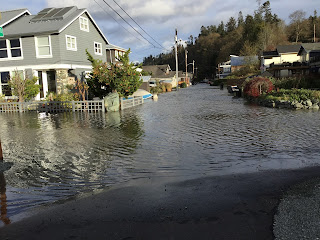
Photo of coastal flooding on Camano Island by Joan Schrammeck
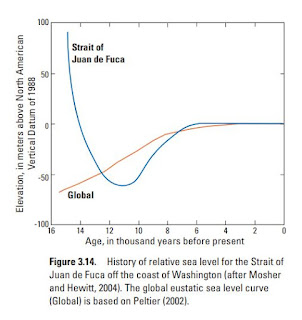
In the sea level rise planning world we do a good bit of fretting about what sort of responses we might expect from the human communities along the shoreline, experiencing impacts associated with sea level rise. We often emphasize that there is no precedent for understanding how human communities will respond, given that the sea level change we are expecting is, itself, unprecedented. But this, of course, is not true. Sea level HAS risen during the Holocene:
Estimated sea level curves for the past 15,000 years for the Strait of Juan de Fuca and globally. From here.
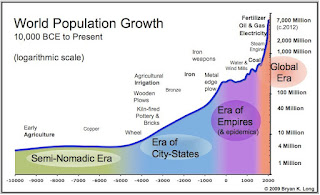
during time periods when the human population was also increasing, and even when humanity was beginning to settle into communities:
Estimated global population over the last 12,000 years. From here.
So it is perhaps not at all a stretch to imagine that there are some templates out there for understanding how people may have responded. Indeed, its also not a stretch to imagine that the earliest occupants of the Olympic Peninsula observed and experienced sea level change, something i've mused on in the past, though the traces of those people on the landscape are few and far between. A few more detailed examples are starting to emerge, though, that perhaps point to a variety of responses, including one just out of last week's 2021 AGU meeting. In this case a fascinating bit of modeling examining how local sea level in Greenland probably responded to the advance of the Greenland ice sheet during the Little Ice Age suggests that sea level rose quite dramatically in places colonized by Icelanders, and may help to explain the sudden departure of those people back to Iceland. So, perhaps, an example from the past of one of the three big strategies: retreat.
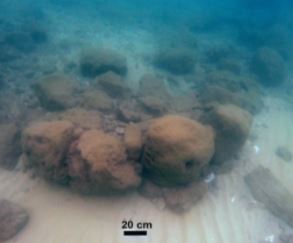
A photo, from Galili et al., showing the remnants of a submerged, 7000 year old sea wall off of the coast of present-day Israel.
In 2019 I was a bit obsessed with another widely-reported paper, published by a team from Israel, describing the remnants of a 7000 year old seawall that now sits under about 20 feet of water. The authors presume that this is one of the earliest known examples of another of the big three strategies: protect. In this case, presumably, the approach was ultimately unsuccessful.
A grain size image collected on 23 November 2011, from about here on the Elwha River delta, at an elevation of 2.5 m MLLW
Over the past few weeks I've been spending unseemly amounts of time sorting and curating approximately 13000 grain size images, like the one shown above, collected over the past 13 years on the Elwha River delta. Once I can get them organized and named, the idea is that they will be run through a classification algorithm developed by Dan Buscombe, and we will have in our hands one of the most comprehensive beach grain size data-sets ever assembled. The idea is to evaluate how grain size on the beach changed before, during and after dam removal dumped thousands of tonnes of dam-trapped sediment at the river mouth. We've published the papers that describe the topographic change associated with that sediment, and we know that beach substrates fundamentally changed because of dam removal. As an example, the grain size photo collected at the site of the photo at top just last month (10 years on), looks like this:
Grain size image collected on 4 November 2021, from about here on the Elwha River delta, at an elevation of 2.5 m MLLW
But what we haven't yet done, outside of an early and middling effort in this paper, is quantified the grain sizes from the photos (which you can do using a variety of digital grain size techniques), and really analyzed the data quantitatively through time. Doing so will allow us to see new patterns, and hopefully connect the grain size changes to topographic change, river sediment delivery, and possibly oceanographic processes (i.e. waves and tides).
13,000 images...that is insane to think about, and represents a LOT of my time over the past 13 years. What does that look like? Mapping the photos doesn't really do it justice, as they are collected on transects...so they sort of stack on top of each through time...but there is a go:
Recent aerial image of the Elwha River delta, overlaid with locations of photos collected during ~50 grain size surveys over 10 years. Each color represents a different day.
Steve Rubin of the USGS emerging out of a plume of fine sediment, kicked up at a site that used to host a higher density of kelps...but where the substrate is now fine enough that kelps have a hard time finding a place to grow. 2 August 2021 photo by Ian Miller
Kelps typically like to attach to and grown on coarse substrates - either bedrock, boulders or large cobbles on the seafloor that allow kelps stay in place in the fierce currents that characterize many of the places they like to live.
Kelp stipes attached to cobbles. As the kelp grew larger they eventually became buoyant enough that these cobbles have been picked up off the seafloor. 14 September 2021 photo by Ian Miller
But in places where there isn't suitable substrate we've found that kelps can still grow by attaching to other organisms, notably tubeworms, which build strong and stable tubes that anchor them in soft substrates.
A tubeworm tube, in this case Eudistylia vancouverii, emerging out of soft sediment at a site near the Elwha River mouth. 28 August 2021 photo by Ian Miller
We've seen this at sites around the Elwha in the past, but this year the phenomenon was very notable at a site right about here, to the west of the Elwha River mouth. This site has always been a good one for tubeworms, perhaps because its a generally pretty silty site. This year kelps, especially Bull kelp (Nereocystis leutkeana), found those tubeworms to be an attractive substrate to grow on. As I cruised around here after we finished our survey I was struck that MOST of the Bull kelp I observed at this site was growing on a tubeworm.
A Bull kelp holdfast and stipe. The holdfast here is growing on and around a tubeworm tube. 28 August 2021 photo by Ian Miller
Close up of a Bull kelp holdfast growing on and over a tubeworm. The tubeworm tube provides an extraordinarily stable and strong substrate for growth, that can support fully grown Bull kelp. 28 August 2021 photo by Ian Miller